Product Module
Prove Measurable Readiness Movement. Not Just a Score, but a Trend Direction.
Weighted scores, cohort benchmarks, and cycle-over-cycle trend lines that answer the one question every reviewer asks: are you actually getting better? Export the improvement evidence auditors, buyers, and insurers verify.
Name one readiness KPI your insurer or buyer asked for. We will show weighted scoring, cohort trend lines, and remediation routing that turns it into defensible evidence.
Best fit
Readiness SuiteExpand to Response Readiness when the workflow broadens.
Best for organizations that need measurable readiness scoring across campaigns, exercises, and training cohorts.
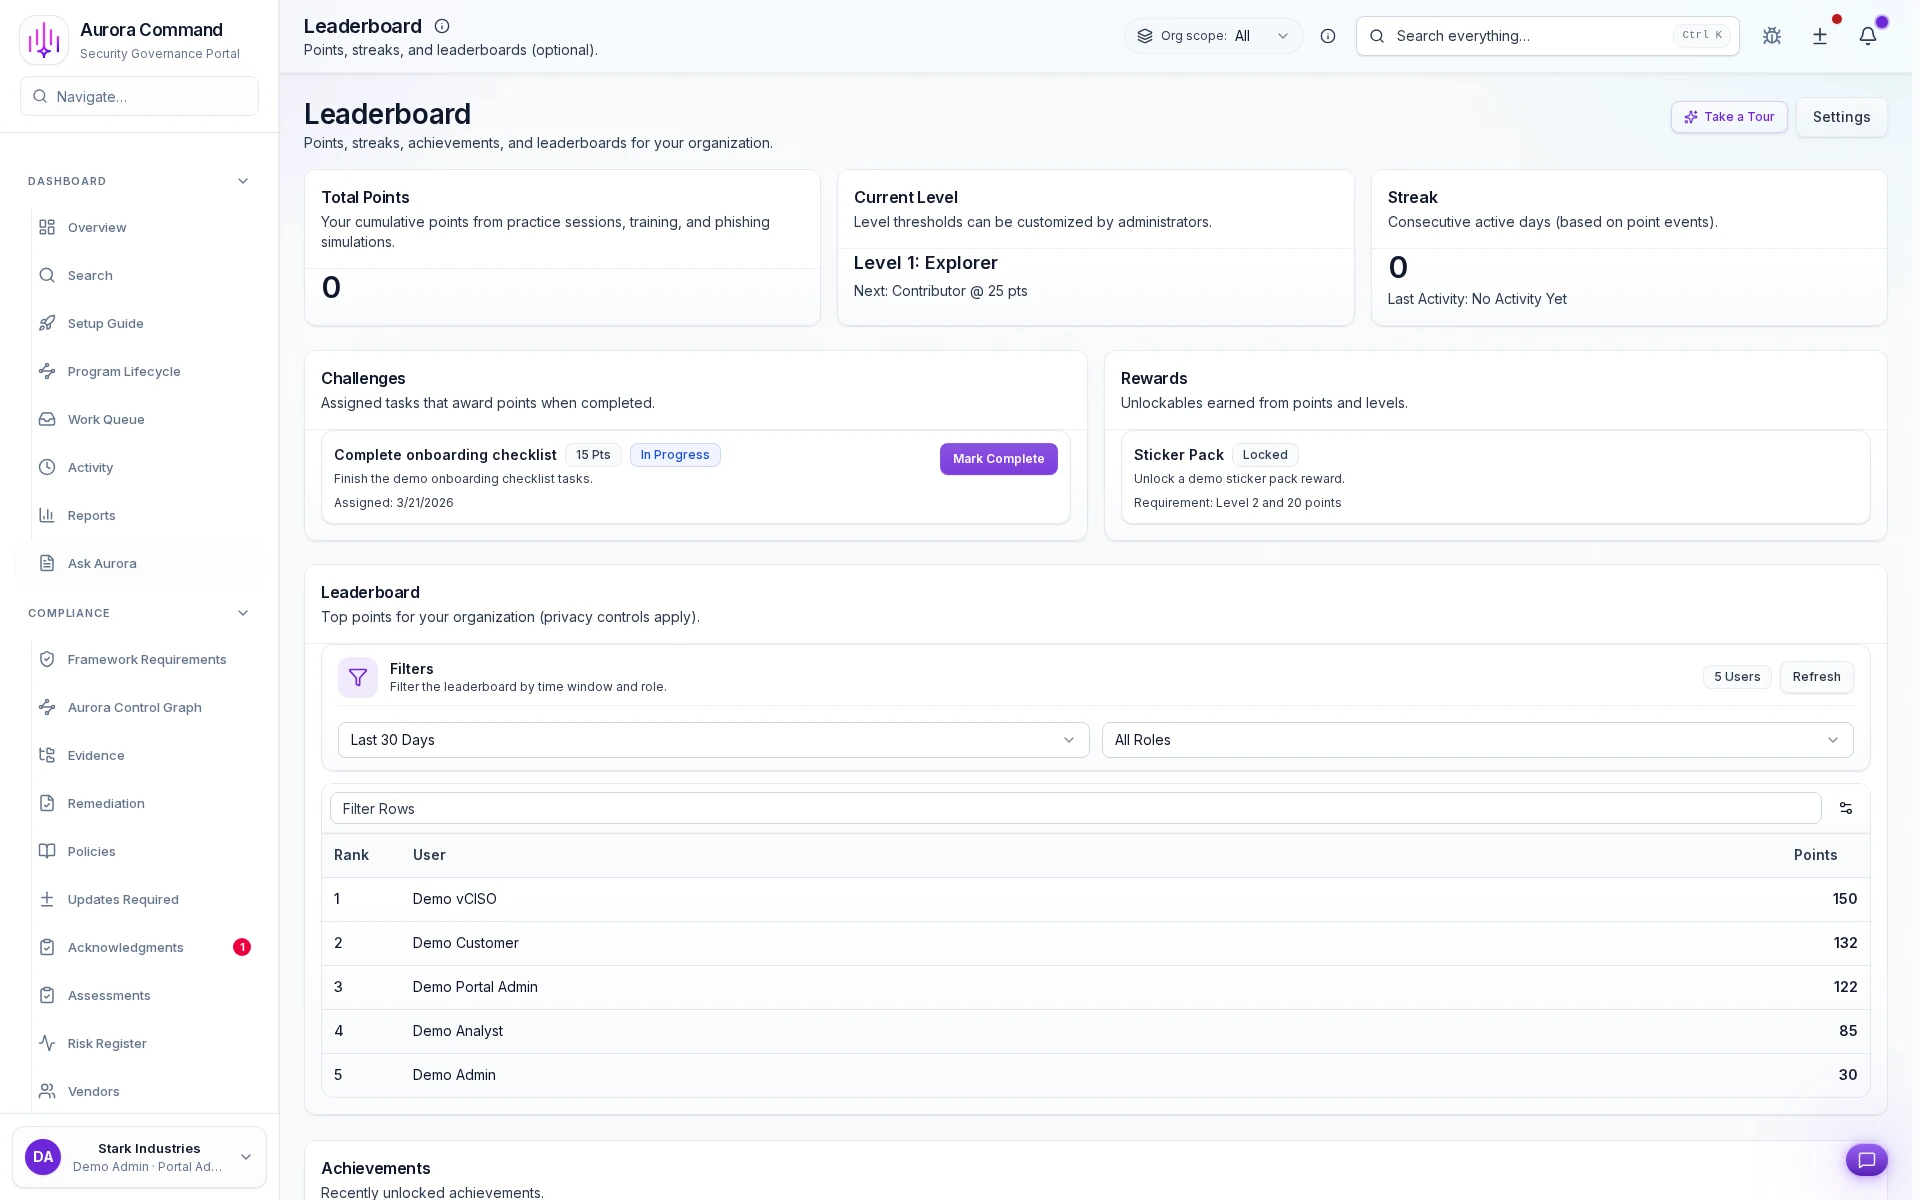
Sample output
Readiness analytics snapshot
Weighted ScoringTrend VelocityCohort BenchmarksImprovement Evidence
The Numbers Behind Defensible Readiness Programs
0°
Readiness Visibility
Aggregate training completion, exercise participation, phishing outcomes, and campaign signals into one weighted readiness score per cohort.
0x
Trend Clarity
Period-over-period scoring shows whether readiness is improving, stagnating, or regressing. Not just a snapshot, but a direction.
< 0 min
Report Generation
Reviewer-safe readiness exports assembled on demand instead of weeks spent manually compiling metrics from disparate systems.
Readiness Suite
Best for organizations that need measurable readiness scoring across campaigns, exercises, and training cohorts.
- Response Readiness: Add incident and exercise records if the score needs operational depth, not just workforce signals.
- Command: Add infrastructure telemetry signals to correlate operational and technical readiness.
Need help choosing?
Compare bundles and module pricing to find the right starting point, then confirm fit in a walkthrough if your workflow is regulated or time-bound.
The Difference Between Guessing And Proving Readiness
Without Aurora
- Readiness is a gut feeling based on anecdotal feedback and one-off training reports
- No way to compare readiness across teams, departments, or business units
- Readiness reports built manually from five different systems every quarter
- Insurer asks 'is your workforce prepared?' and the best answer is 'we think so'
- No connection between readiness scores and the specific activities that drive them
With Aurora
- Weighted scoring across exercises, training, phishing, and campaigns with period-over-period trends
- Cohort-level benchmarking showing relative performance and improvement trajectories
- Automated readiness snapshots exportable on demand with drill-down by signal type
- Defensible readiness evidence with trend data showing measurable improvement over time
- Every score traces back to its contributing signals: training, exercises, phishing, campaigns
From Raw Performance Signals To Defensible Trend Evidence
01
Define weighted scoring criteria
Assign point weights to phishing click-through rates, training pass rates, drill participation scores, and response-time metrics so composite rankings reflect your actual risk priorities, not a one-size-fits-all formula.
02
Ingest live performance signals
Automatically pull simulation outcomes, course completions, tabletop participation, and report-rate deltas into a unified scorecard stream updated after every campaign cycle.
03
Compare cohorts and trend direction
Rank departments, roles, and regional teams side by side, then overlay cycle-over-cycle trend lines to see which cohorts are climbing, stalling, or regressing across review windows.
04
Trigger targeted follow-up actions
Route cohorts below your score threshold into owned remediation queues with assigned owners, due dates, and escalation paths so low scores become accountable action items.
05
Export defensible score evidence
Package weighted scorecards, trend movement charts, and cohort comparison tables into governed exports formatted for insurer renewals, buyer security reviews, and audit sampling.
Key Capabilities
Feature 1 of 6: Weighted Readiness Scoring
1/6
Weighted Readiness Scoring
Assign configurable point weights to phishing click rates, training completion percentages, drill response times, and report-rate deltas so composite scores map directly to your operational risk model.
Artifacts reviewers recognize, plus sample previews of structure.
Scroll for artifact previews
Keep Score Inputs And Cohort Rosters Synced With Workforce Reality
Extend This Workflow
- Simulations & SessionsTabletop outcomes and drill participation feed directly into weighted readiness scores.
- Phishing SimulationsCampaign click-to-report ratios contribute cohort-level signals to readiness trend lines.
- Training & AcknowledgmentsCourse completion rates and pass percentages drive score movement per cohort.
- GovernancePolicy attestation and control coverage mapped to readiness scoring criteria.
Questions Teams Ask About Readiness Analytics
How does the weighted scoring methodology work?
How does the weighted scoring methodology work?
You assign point weights to each signal type (phishing click-through rate, training pass rate, drill response time, report-rate delta) and the platform computes a composite score per person and per cohort. Weights are fully configurable so your rankings map to operational risk priorities, not a generic formula.
What defines a cohort, and can we customize groupings?
What defines a cohort, and can we customize groupings?
Cohorts can be departments, job families, offices, manager hierarchies, or any custom segment synced from your identity provider. You can create overlapping cohorts to compare the same people across multiple dimensions.
Over what timeframes are trends calculated?
Over what timeframes are trends calculated?
Trend lines are calculated per review cycle (typically monthly or quarterly) and can span any window you define. The platform stores historical scores so you can view 90-day, 6-month, or year-over-year trajectories at any time.
What evidence do insurers and auditors actually receive?
What evidence do insurers and auditors actually receive?
Governed exports include weighted scorecards, cycle-over-cycle trend charts, cohort comparison tables, and improvement percentage summaries. Each artifact carries scoring-criteria context so reviewers can verify methodology without a walkthrough.
Can low scores trigger remediation automatically?
Can low scores trigger remediation automatically?
Yes. Cohorts that drop below a configurable threshold are routed into remediation queues with assigned owners, due dates, and escalation paths. Completion tracking closes the loop so you can show reviewers that every gap was addressed.
Reviewers Want Trend Direction, Not A Single Snapshot. Show Them Both.
Share your readiness KPIs. We will show weighted scoring, cohort trend lines, improvement velocity, and governed export evidence in one workflow.
Share your latest readiness report. We will show how Aurora turns trend movement into reviewer-safe evidence, not just internal scoring.